


Four Key Reasons to Learn Markdown
Back-End Leveling UpWriting documentation is fun—really, really fun. I know some engineers may disagree with me, but as a technical writer, creating quality documentation that will...
When designing a web application, a strategy that has often been used is to use a monitoring tool such as Grafana or Datadog. There are many benefits to doing this such as log querying, monitoring health of applications, and viewing performance; instrumentation of custom metrics and log tags can help when identifying problems. How is this instrumentation setup and how can this be visualized within the monitoring tools?
Monitoring tools such as Grafana and Datadog are used in everyday commercial applications for tasks such as log querying, monitoring the health of applications, and viewing performance. Log querying can be integrated with tools such as Loki for log integration into these monitoring tools. The health of web applications can be alerted by using features such as dashboards which allow for a birds-eye view of how an application is doing from a high level. Many choose to include metrics such as failures from a particular endpoint or error logs to determine the application’s health. Service performance can be considered in the service health as well in determining the health. Custom metrics can help with determining failure reasons or counts of specific failures within an application.
Prometheus is a framework that can help capture these custom metrics. By instrumenting an application and exposing it, these metrics can be scraped by a monitoring tool for visualization and querying purposes. The example below shows how Prometheus can be used to instrument a sample Go application and how the metrics can be transformed in Grafana.
The below example demonstrates how Prometheus metrics are instrumented into a Go web application. The code in this article is part of a larger runnable demo available in BNR-Blog-Prometheus-Monitoring. It relies on:
The Kubernetes setup for this example was configured using Helm. This allows a service chart to be instantiated along with any dependencies noted in the Chart.yaml file. A lot of the upfront work of defining the service configurations is handled automatically by Helm with the helm create command.
Skaffold is paired alongside Helm for making local deployment easy. This will handle Dockerfile image building/caching, deployment through Helm, and port-forwarding the service ports to the host machine. The sample repo listed above contains the instructions for how to run this example locally.
func HandleRoute(logger *zap.Logger) http.HandlerFunc {
    return func(writer http.ResponseWriter, request *http.Request) {
        queryParams := request.URL.Query()

        if _, ok := queryParams["failure"]; ok {
            if failureReasons, ok := queryParams["reason"]; ok {
                failureCounter.With(prometheus.Labels{"reason": failureReasons[0]}).Inc()
                logger.Error("error with sample route", zap.String("reason", failureReasons[0]))
            } else {
                failureCounter.With(prometheus.Labels{"reason": "server_error"}).Inc()
                logger.Error("error with sample route")
            }
            writer.WriteHeader(http.StatusInternalServerError)
        } else {
            successCounter.Inc()
            logger.Info("successful call to sample route")
            writer.WriteHeader(http.StatusOK)
        }
    }
}
HandleRoute() defines the handler function for the route: /sample-route. The route is intended to be used to trigger a success or failure depending on if the failure query parameter is set. When a success occurs, the Prometheus success metric counter is incremented by one. When a failure occurs, the Prometheus failure metric counter is incremented by one. If a failure reason is provided, that is provided as a label on the metric or defaults to server_error if it is not provided. There are also formatted JSON logs for each case that can be found in Grafana.
Using the above custom metrics/logs allows for greater customization on specific failure cases in Grafana when monitoring the service. The Grafana dashboard shows the endpoint health based on failure reason and displays the failure rate based on the metrics. The dashboard also shows the error logs associated with the service. An example of the Grafana dashboard that utilizes these captured metrics and logs is below.
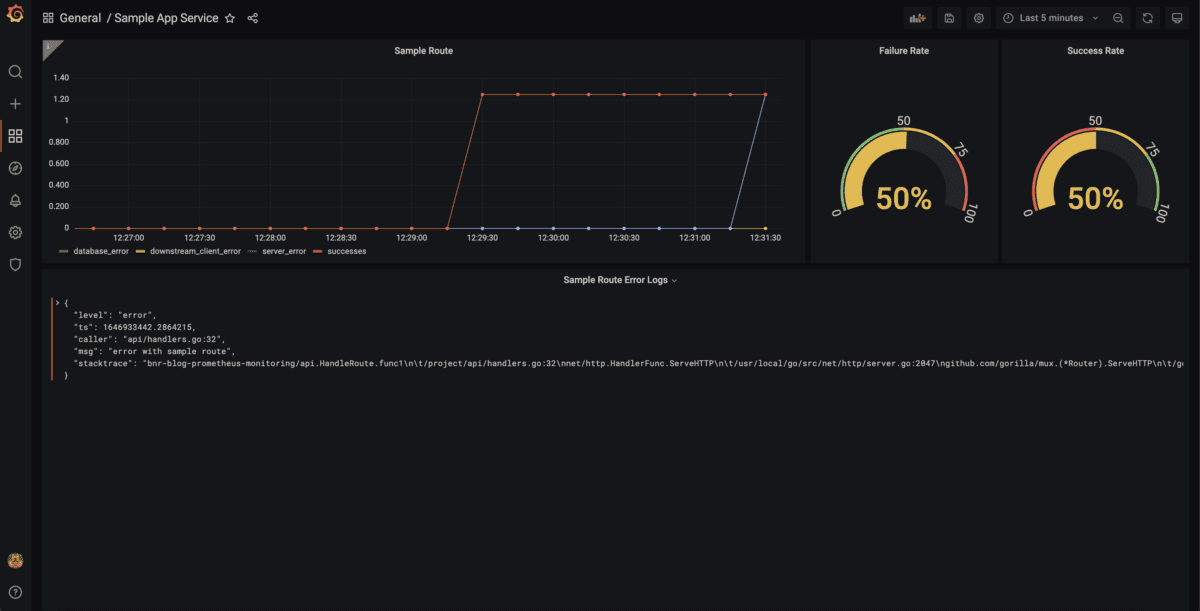
The dashboard shows the high-level status of the sample-route endpoint and thus the sample app since this is the only route served. The success/failure rate is calculated based on the exposed Prometheus success/failure metrics. The specific failure reason is shown in a time series so specific error spikes can be observed. There are error logs below if more inspection on the error reasons is desired. If tracing is connected to the logs, one could click on the error log instance to view the full timeline of the request to see a detailed view of what occurred.
In summary, the instrumentation of a web application can be accomplished using Prometheus or a similar framework. These metrics are then scraped through an exposed endpoint into the preferred monitoring solution. Grafana or a similar solution can then be used to ingest these metrics and visualize them through dashboards. These dashboards can be useful for determining the health of an application and the details of a failure. In addition to metrics, structured logs can be useful in these dashboards for showing relevant information associated with failures. Attaching traces to these logs is also beneficial as a developer can trace the lifecycle of the request to see how a specific request might have failed.
Writing documentation is fun—really, really fun. I know some engineers may disagree with me, but as a technical writer, creating quality documentation that will...
Humanity has come a long way in its technological journey. We have reached the cusp of an age in which the concepts we have...

Go 1.18 has finally landed, and with it comes its own flavor of generics. In a previous post, we went over the accepted proposal and dove...