Replacing Myself: Writing Unit Tests with ChatGPT
Leveling UpThe Bot that’s got everyone talking The science-fiction future is among us as we find ourselves on the precipice of an AI revolution. As...
The Instruments Time Profiler is a common tool to use when finding out how much CPU time is being consumed for an operation, either directly by a function or a method, or on behalf of some other piece of code. You might discover that your image drawing is causing huge amounts of image conversion inside of Quartz. You’d then make sure your image is in a state that makes it draw faster.
This doesn’t help if your program is taking a lot of time to do stuff, but none of that time is actually doing work scheduled on a CPU. You’re blocked waiting for a mutex. Or maybe you’re waiting for a network packet to arrive, or Core Data is off contemplating its navel. Wouldn’t it be nice if there were a way to record wait-time with the time profiler?
(TL;DR – Select Record Waiting Threads in the Time Profiler track info-panel thing.)
I was working on a bug with my friend and Ranch colleague Owen Matthews. We were tracking down a performance problem that was causing a tableview to scroll poorly. After a bunch of code inspection and walking through the problem we weren’t any closer to a solution. That’s the point when I pretend to forget everything I know about the system and pull out some measuring tools. Mental gymnastics are fun, but sometimes you need real data.
Time Profiler is my first go-to instrument when it comes to visible performance problems. Usually something is going nuts on the CPU and slowing things down. Drawing an image that’s five times too large. Transparent views with lots of shadows and gradients. Even problems like memory churn can appear as CPU hotspots in memory allocator code. So with great excitement we ran the app under instruments, and exercised the problem.
Nothing. Rats.
There was a spike of activity as the app was getting set up, then once we started scrolling the list around, there was little activity. That means that something was blocking, consuming time but not CPU. When a call blocks, the thread making that call is not scheduled on the CPU. It’s just sitting on a list somewhere waiting for something exciting to happen, like waiting for some bytes to appear from a disk read. This doesn’t work well with the CPU profiler who interrupts the system repeatedly and looks at the CPUs currently scheduled and running code.
A caveman way to look for performance problems is what I call stochastic profiling – run your program under the debugger, interrupt it randomly and look at the stack trace. Hopefully after a couple of rounds of this you see a pattern. This is a great technique if your blocking time is long-lived (more than a couple of seconds). Sometimes it’s the only technique available to you if you’re in a situation where you have no performance tools, or they’re broken in your particular scenario. Some of us old-timers might remember the Metrowerks Code Warrior system. It had a great profiler, except it was documented not to work with threaded apps, or with code in shared libraries. Guess who had a show-stopper performance problem in a shared library loaded by a threaded application…
But we have Instruments, and it works most of the time. Unfortunately neither of us knew how to make instruments record wait-time rather than on-cpu-time. Time to explore!
Luckily, with Instruments, there are a lot of knobs and buttons you can twist and push to get different behavior from the tool. When I introduce a group of programmers to Instruments, I always tell them “look under the rocks.” Play around. Click everything. In particular, the info button on the instrument track:
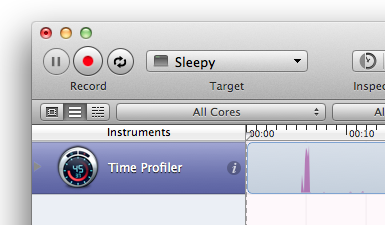
Sometimes the info panel that shows up is worthless, only having track display options. Sometimes it can be like the memory allocation tool and have a huge amount of cool stuff in it. The Time profiler has something interesting:
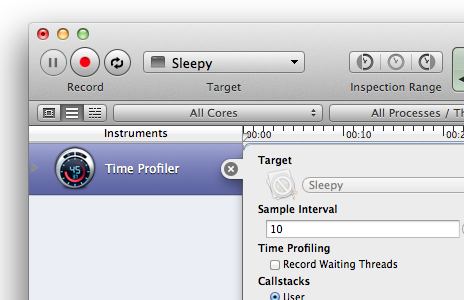
Record Waiting Threads. That sounds promising. We turned it on, reproduced our problem, and lo-and-behold, we had waiting time recorded. Turned out it was something deep inside of core data loading a relatively large amount of data whenever a new table view cell was drawn. We figured out what part of our code would be tickling something like that, and fixed the bug.
That project is long gone and delivered to the client, so I can’t show you how things appeared in instruments. Here’s a small example though, if you want to follow along. Make a new single-view project, add a button, and in the IBAction, do some sleeping. This is in my view controller, triggered by a UIButton:
- (IBAction) snorgle {
    NSLog (@"START");
    [self doThis];
    NSLog (@"END");
}
- (void) doThis {
    [self doThat];
}
- (void) doThat {
    sleep(2);
    [self doTheOtherThing];
}
- (void) doTheOtherThing {
    sleep(5);
}
When you run the app and tap the button, the UI will freeze for seven seconds, and get a log:
2013-10-10 10:58:57.018 Sleepy[34820:a0b] START
2013-10-10 10:59:04.024 Sleepy[34820:a0b] END
Yes, that looks like seven seconds.
If you run the app in Instruments with the CPU profiler, it looks kind of lame:
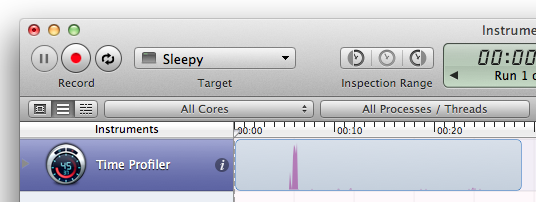
The call tree looks even lamer:
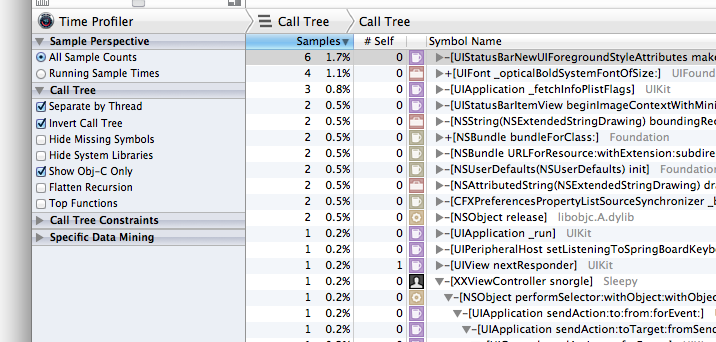
The status bar drawing code is at the top, and the profiler only caught the snorgle method, and not the ones that it called. This data is not helpful in tracking down the problem. So, turn on Record Waiting Threads:
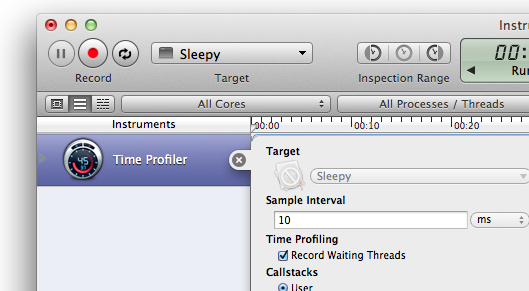
And re-run it. The CPU trace is still boring:
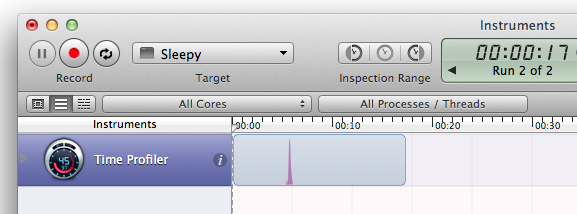
But now the call tree is most useful:

It can even tell you the waiting breakdown:
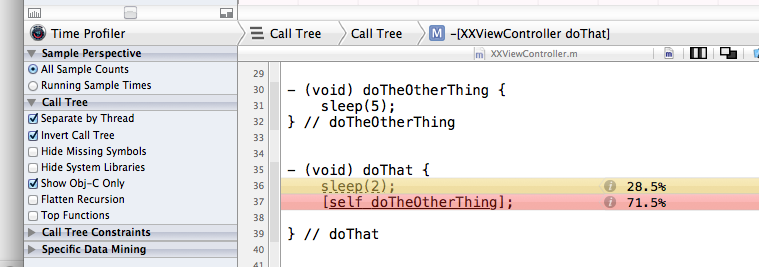
So the smoking gun is around snorgle / doThat / doTheOtherThing. Being able to go from “OMG what’s going on?” to “look around these three methods” is huge.
The takeaway? Click all the things inside of Instruments. The particular feature you need might already be there.

The Bot that’s got everyone talking The science-fiction future is among us as we find ourselves on the precipice of an AI revolution. As...
Big Nerd Ranch is chock-full of incredibly talented people. Today, we’re starting a series, Tell Our BNR Story, where folks within our industry share...

Writing documentation is fun—really, really fun. I know some engineers may disagree with me, but as a technical writer, creating quality documentation that will...