

Swift Regex Deep Dive
iOS MacOur introductory guide to Swift Regex. Learn regular expressions in Swift including RegexBuilder examples and strongly-typed captures.
Instruments is a cool tool. There is a lot it can do beyond “simple” things like profiling your application’s execution time or finding your memory leaks. It can also give you holistic views of the activity on a device, such as power consumption.
If you kind of already know this stuff, or are revisiting this page (hello future people!) check out the TL;DR at the end.
 Instruments comes with an Energy Diagnostics template.
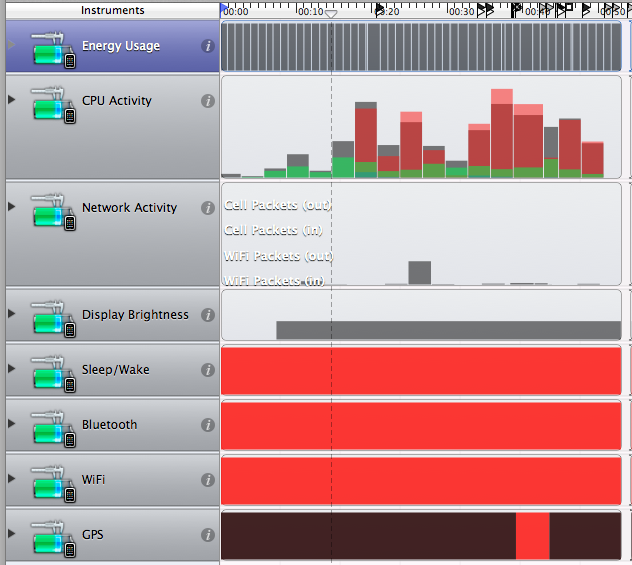
This template has eight pre-configured instruments that record CPU and network activity, display brightness, when the device went to sleep and wake up, and when various radios turn on, like Bluetooth, WiFi, and GPS. There’s no instrument for the cellular radio, alas.
Here’s a sample run, started within Xcode using Xcode -> Open Developer Tool -> Instruments, and chose the Energy Diagnostics template. I Clicked the bright red record button, woke up an attached iPad 2, went to the home screen, opened Safari and loaded a page, then went to Maps, finally running one of my own apps. There’s a lot of neat information there:
Let’s take a closer look the information available here.
There’s a lot of flags on the timeline:

That flag density is kind of obnoxious to paw through. You can click on a flag and get a description, with arrows that let you from flag to flag:
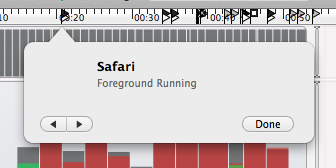
You’ll want to use Command-left/right arrow to move between flags. Otherwise you may start hating the world because the forward/back arrows move, and are positioned right next to each other so it’s very easy to have the wrong button scoot under your mouse right before you click.
There’s also a tabular listing available via Window->Manage Flags:
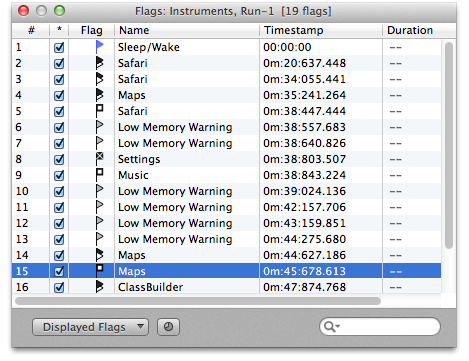
You have to know what the flag icons mean to understand the list. You can double-click a flag in the table to display its info in the timeline, making the icon-figuring-out pretty easy.
From top to bottom these eleven different groups of flags are:
Device changed wake/sleep state
Safari running in the foreground
Safari moved to the background
Maps running in the foreground
Safari suspended in the background
Two low-memory warnings, which are system-wide alerts
Settings got terminated
The music player was suspended
Four more low memory warnings
Maps is backgrounded and suspended
ClassBuilder becomes the foreground app.
These flags aren’t limited to the Energy Diagnostic template. Any document with an “All Processes” target will get them.
Now for the instruments tracks. I’ll leave the Energy Usage one until the end because there’s a fun gotcha relating to it.
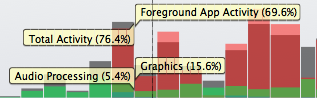
CPU Activity is first on the plate. It shows where the CPU is spending its time. There’s a good correlation between lots of CPU activity and power drain, so it’s good to know what your application is doing, as well as what’s happening in the rest of the system:
The little flags are from scrubbing the playhead back and forth. Always scrub the playhead to get the actual percentages – you can’t trust the height of bars in instrument tracks to be uniform from run to run.
CPU Activity defaults to a stacked bar chart showing you the CPU used for audio processing, graphics processing, the foreground application activity, and total activity on the system. Other processes on iOS can contribute to this extra activity without falling into the graphics/audio buckets. You can look at energy spikes as well as the CPU distribution to see if you’re hitting the graphics or audio systems too hard. Maybe using audio in a different format could use a hardware playback path instead of using a software converter.
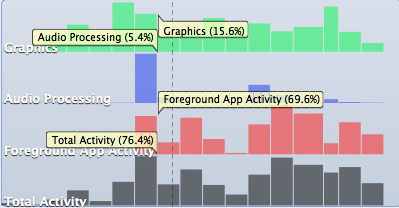
Don’t forget to “look under the rock”, the info button by the instrument name. You can change the display type to “Stacked” and get the same information in a different layout, making it easier to see the different CPU-time contributors:
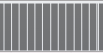
Next is the Network Activity instrument. I didn’t do a whole lot of network activity – just loaded a couple of small pages in Safari:
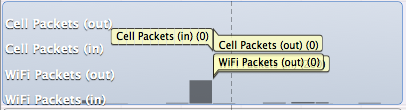
Unfortunately the label collision avoidance algorithm is not great. There’s a “WiFi Packets (in) (206)” hidden behind the packets-out label. You can switch to a different display type if this happens to you. This instrument shows you packets in and out, both for the cell connection and WiFi. There’s no dedicated instrument for knowing when the cell modem is powered up or down, but you can examine your packet transfer rates here. If you have a lot of closely spaced small-packet blips, that may mean that the cellular radio is remaining in a high-powered state, as opposed to widely-spaced multi-packet blops.
Display Brightness shows the brightness of the display (duh):
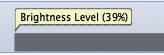
The main use of this is making sure your screen brightness is consistent from run to run if you’re doing serious energy profiling. A maxed-out eye-burning brightness consumes a lot more power than a very dim screen.
The next three instruments, Sleep/Wake, Bluetooth, and WiFi are just big red bars for my sample run. Sleep/Wake does show system sleeping and waking, but it takes it several seconds from when the screen darkens to when the device actually begins sleeping. You’ll see the sleep/wake cycle easier when you import energy diagnostics from a longer run-time. More on that later.
The Bluetooth and WiFi bars are on (bright red) because I never explicitly turned either of them off, so they appear as on.
The final bar shows the GPS radio:
This correlates to the Maps application being run. The GPS stays on for a little while after Maps was backgrounded, and then got shut off for energy savings.
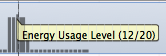
So, what about that top bar, “Energy Usage.” It shows the energy consumption on a scale from 1 to 20, where 1 is “I can run for days and days like this” and 20 is “If you keep this up, find a charger.” My run here looks pretty uninteresting:
That’s because the iPad was tethered to the computer. When I was first learning-up on this stuff, I was confused why I never got anything except full bars up there (the tricorder must be broken). When I have unfathomable questions, I ask some Very Smart friends online.
After about 15 seconds, someone replied back. “Are you plugged in to the USB port? You’re charging the battery. Of course you’re not going to get energy drain results.” Well, that was embarrassing.
Here’s an example from a more interesting run: This is something happening (I think loading another page in Safari), followed by some idle time, and finally the device went to sleep
So, if the device charges while tethered, how can you get energy usage information? Turn on Energy Diagnostics logging from Settings. This is available on devices that have been used for development. Go to Settings and select the Developer settings:
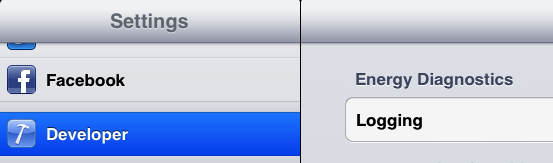
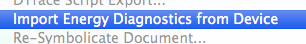
(There’s an on/off toggle by Logging). Turn that on and use your device. It’ll happily be recording all sorts of stuff. When you’re ready to analyze the data, plug in your device, start up Instruments with the Energy Diagnostics template, go to the File menu and choose Import Energy Diagnostics from Device:
You’re wanting to diagnose energy issues, or maybe to see what your system is doing at a high-level over a span of time.
Make sure the device is developer-enabled
Unplug the device from the computer
Turn on Energy Diagnostic Logging from Settings. Toggle it off and back on to clear out any previous recorded data.
Run through some scenarios
In Instruments, make a new document from the Energy Diagnostics template
File -> Import Energy Diagnostics from Device
Happy analyzing
Got any Energy tips or tricks, or any cool Instruments hacks? Share them in the comments!
Our introductory guide to Swift Regex. Learn regular expressions in Swift including RegexBuilder examples and strongly-typed captures.

The Combine framework in Swift is a powerful declarative API for the asynchronous processing of values over time. It takes full advantage of Swift...
SwiftUI has changed a great many things about how developers create applications for iOS, and not just in the way we lay out our...