This past week I came across the problem of debugging multiple mobile devices. Again. It seems that when things go bad with good programs, seldom do any suggestions reveal themselves. Instinctively I turned into the itinerant detective, searching for the clues that would lead to a smoothly running program. Like any good engineer, I try to keep abreast of the best tools available, so it seemed a good time to reacquaint myself with the Chrome Inspector, looking for more tools to sniff out bugs. I found that a great introduction to the Chrome Inspector in Paul Irish’s A Re-introduction to the Chrome Developer Tools at Google I/O.
The post Got WEINRE? appeared first on Big Nerd Ranch.
]]>This past week I came across the problem of debugging multiple mobile devices. Again. It seems that when things go bad with good programs, seldom do any suggestions reveal themselves. Instinctively I turned into the itinerant detective, searching for the clues that would lead to a smoothly running program. Like any good engineer, I try to keep abreast of the best tools available, so it seemed a good time to reacquaint myself with the Chrome Inspector, looking for more tools to sniff out bugs. I found that a great introduction to the Chrome Inspector in Paul Irish’s A Re-introduction to the Chrome Developer Tools at Google I/O.
After reviewing the Chrome Inspector for some of the less-used but more effective methods, one stood out: remote debugging. For some time now Chrome has had the capability to start the browser listening on a port. This port allows a second browser to navigate to the first browser’s address + port and begin remote debugging. In this remote debugging session you have every tool available to you as if you were working in the same browser window. Wow! Things will be a little easier when you separate the debugging environment. But wait, there’s more!
At the Big Nerd Ranch we often find ourselves needing to debug device-specific errors in a single HTML5 codebase, accommodating a litany of devices. Such a process can stir the pudding and leave a mess of devices on your desk. That’s were WEINRE (Web Inspector Remote) comes in. From the great ether comes a tool that allows you to debug from your desktop any mobile device running HTML5. It has most of the tools found on Chrome Inspector (excepting the script step debugging). Even without that, you get a huge amount of access to your web app as it runs on the device.
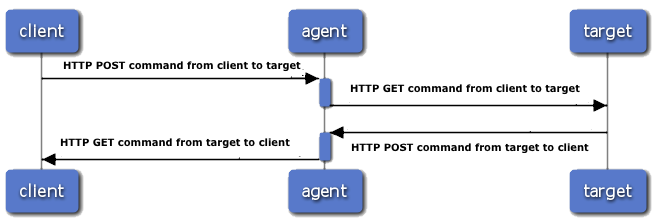
WEINRE sets up a “Target”, “Client”, and an “Agent”:
 (thanks to Patrick Meuller of WEINRE for the diagram)
The Target is the intended mobile device to be debugged. The Client is the web inspector code running as a web page. And the Agent is the HTTP server that allows the Target and Client to communicate. The Target and Client are web pages and thus use the Agent server as a “gateway” to connect via HTTP GET and POST commands. WENIRE only runs on Webkit based browsers because WEINRE takes advantage of capabilities within Webkit API.
This sounds totally magical. Let’s get WEINRE up and running with to see what the fuss is all about. First thing you will need to do is get a version of WEINRE, which you can get via NPM (Node Packaged Modules), which comes with node.js. If you do not have node yet you can get it at http://nodejs.org. Once you have node with NPM, go to your terminal and enter this command:
$ sudo npm -g install weinre
If all goes well you now have a version of node. Start a WEINRE server:
$ weinre -v
This starts the server and gives you the baseline information on your installation of WEINRE with default settings. Okay, shut ‘er down with a control-C. Time to go live! First you need to know your IP address. If you do not know your IP address type the following into the command line:
$ ifconfig
You’ll get output like this, with the interesting stuff bolded:
...
en1: flags=8863 mtu 1500
        ether 90:27:e4:fd:b5:80
        inet6 fe80::9227:e4ff:fefd:b580%en1 prefixlen 64 scopeid 0x5
        inet <strong>10.0.1.55</strong> netmask 0xffff0000 broadcast 10.0.255.255
        media: autoselect
        status: active
...
Your IP address is prefixed by “inet” and looks something like “10.0.1.55” You should put in your IP address where you see XX.XX.XX.XX. To start the Agent, which will be the server between the Target and the Client, use this command:
$ weinre --boundHost XX.XX.XX.XX
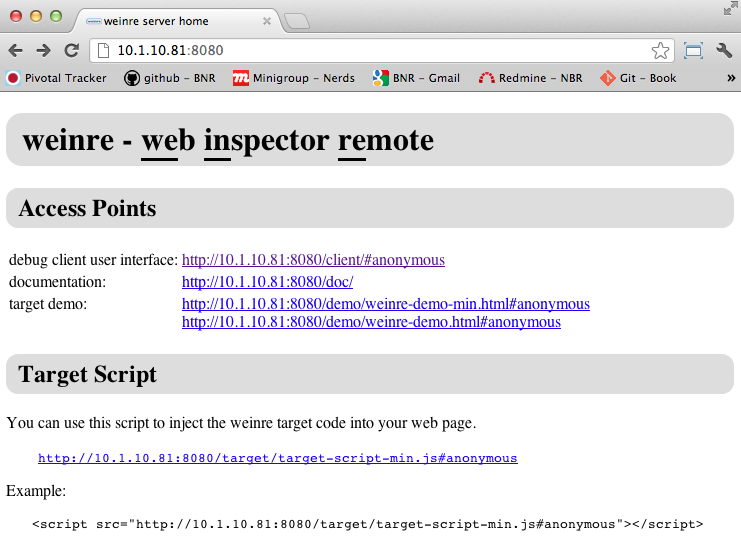
Now that WEINRE is installed and running a server, connect to the main page of WEINRE by opening your webkit-based browser by putting this in the address bar:
http://XX.XX.XX.XX:8080/

This address includes the default port 8080. On this page there will be a script that you will cut and paste into your project code right before the closing HEAD tag. This code will set up any mobile device that runs your code as a Target. It should look something like this:
<script src="http://XX.XX.XX.XX:8080/target/target-script-min.js"></script>
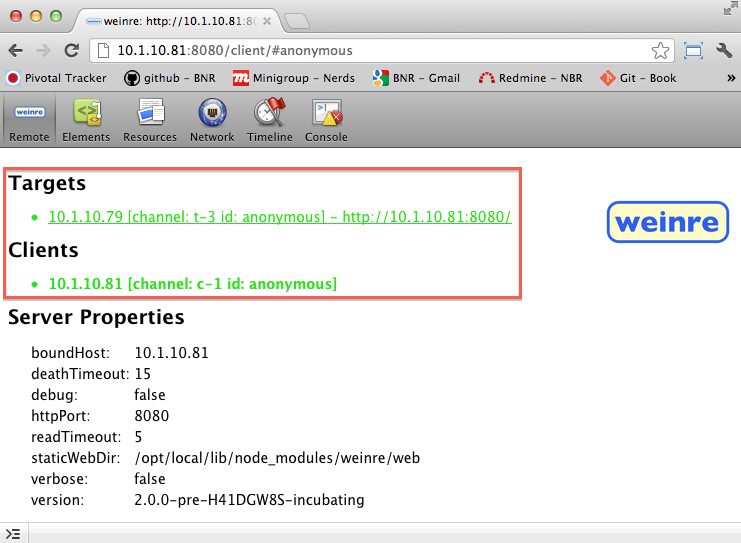
Now that the server is running and your code has the target script, connect to the server debugging portal on your desktop by visiting this address:
http://XX.XX.XX.XX:8080/client/#anonymous

You should now see that you and the Client are connected. Now on your mobile device go to the XX.XX IP address and then navigate the folders to the main page of your code. Because the target script was saved in your code you should now be connected. You can check this by going to the debugging portal and seeing that Target” is now connected and shows the text in a green color.
Be aware of security concerns! Remote debugging is a powerful tool when you’re tracking down problems in your code. It’s a bad idea to leave this script in your code when you are not debugging. This lets others debug your code for you. Even during development someone with the correct address could access your debug server. Make sure to remove the target script from production code and turn off your debug server when not in use. Patrick Mueller has some other security tips.
Now (a) that the server is up and running on port “8080”, (b) the desktop is connected to the debugging portal, (c) the mobile device has been targeted and connected to the debugging portal, you can use the tabs at the top of the debugging portal to analyze your code as it is running in the mobile device. Congratulations, you are done. Well, done with the tool setup. The actual debugging is up to you.
See, remote debugging is not that scary. Now, just like a wizard, you can reach through the ether and manhandle that pesky CSS. Or if you’re tired of trying to figure out what the session variables are doing, just check the resources tab . Want to do a little caveman debugging and send a little love via the console, WEINRE’s got you covered. Just click the console tab. Now just because your little app got all grown up and found a nice device to settle down with doesn’t mean you can’t reach out a put a little smack-down when it gets out of hand.
The post Got WEINRE? appeared first on Big Nerd Ranch.
]]>